Article guideContents, topics, tags, and RSS
Visual Studio 2017 introduced JavaScript debugging that launched a separate Chrome instance when an ASP.NET project started. That was useful when debugging client-side code, but distracting when the extra browser integration was not needed.
Visual Studio 2017 and 2019 setting
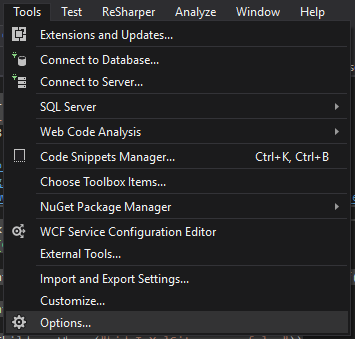
Open Tools → Options.
Go to Debugging → General, then clear Enable JavaScript debugging for ASP.NET (Chrome and IE).
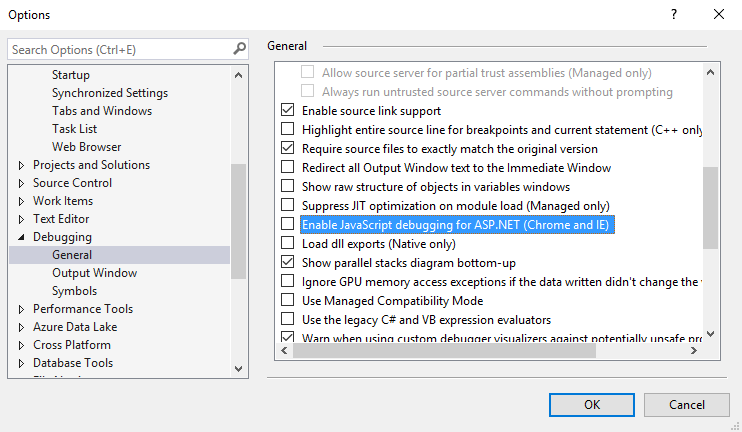
The project should now launch in the normal browser without attaching the older JavaScript debugger. Select the option again if you need that debugging integration.
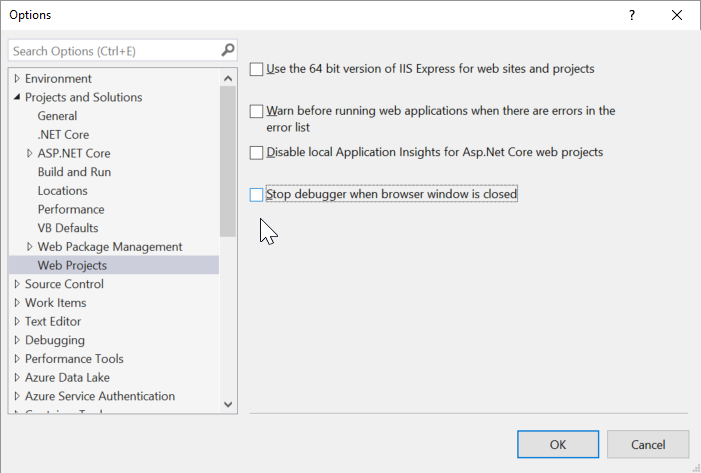
For later Visual Studio 2017 updates, another related option appeared under Tools → Options → Projects and Solutions → Web Projects. Clear Stop debugger when browser window is closed if closing the browser should not stop the debugging session.
Current Visual Studio guidance
In current ASP.NET Core projects, inspect the active debug profile in Properties/launchSettings.json. The launchBrowser setting controls whether the selected profile opens a browser:
{
  "profiles": {
    "MyApplication": {
      "commandName": "Project",
      "launchBrowser": false,
      "applicationUrl": "https://localhost:7001;http://localhost:5001"
    }
  }
}
Visual Studio can regenerate or edit launch profiles through the project debug properties. Treat the exact settings UI shown above as historical; profile behavior and labels vary by project type and Visual Studio release.